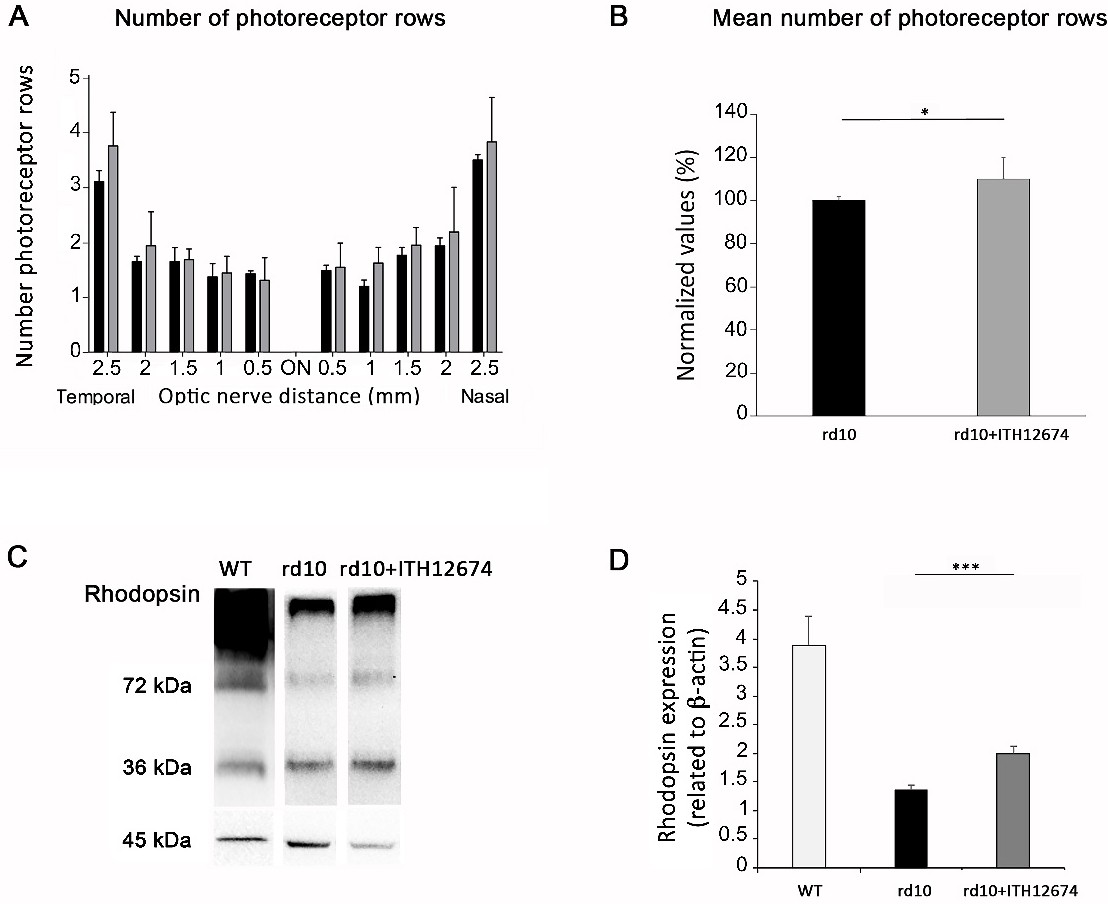
Fig. 5. Effect of ITH12674 treatment (10 mg/kg) on photoreceptors of rd10 mice. (A) Quantification of photoreceptor rows along central sections of the retina in both, non-treated and treated retinas (at least n=3 in each condition). Error bars represent the SEM. (B) Normalized mean values of photoreceptor rows in both, non-treated and treated retinas. (C) Image of representative Western blots showing rhodopsin levels in non-treated and ITH12674-treated rd10 mice. Rhodopsin expression in a C57BL/6J mice (WT) is shown as reference. Immunoreactive bands at 36 kDa belonging to rhodopsin monomers can be observed. Higher bands correspond to rhodopsin dimers and multimers. All bands were quantified in each lane. Western blots were performed by triplicates. (D) Bar graph shows the quantification of rhodopsin levels analyzed by Western blotting in treated and non-treated rd10 animals, 3 animals in each condition. Expression levels in C57BL/6J mice (WT) are shown as reference. Data are normalized to the expression of β-actin. *P<0.01.